Stop reading candles and start reading the tape. VolumeLens shows you exactly where aggressive buyers and sellers hit the book — at every price level, on every NSE, BSE, and NFO instrument. See what moves price before it moves.

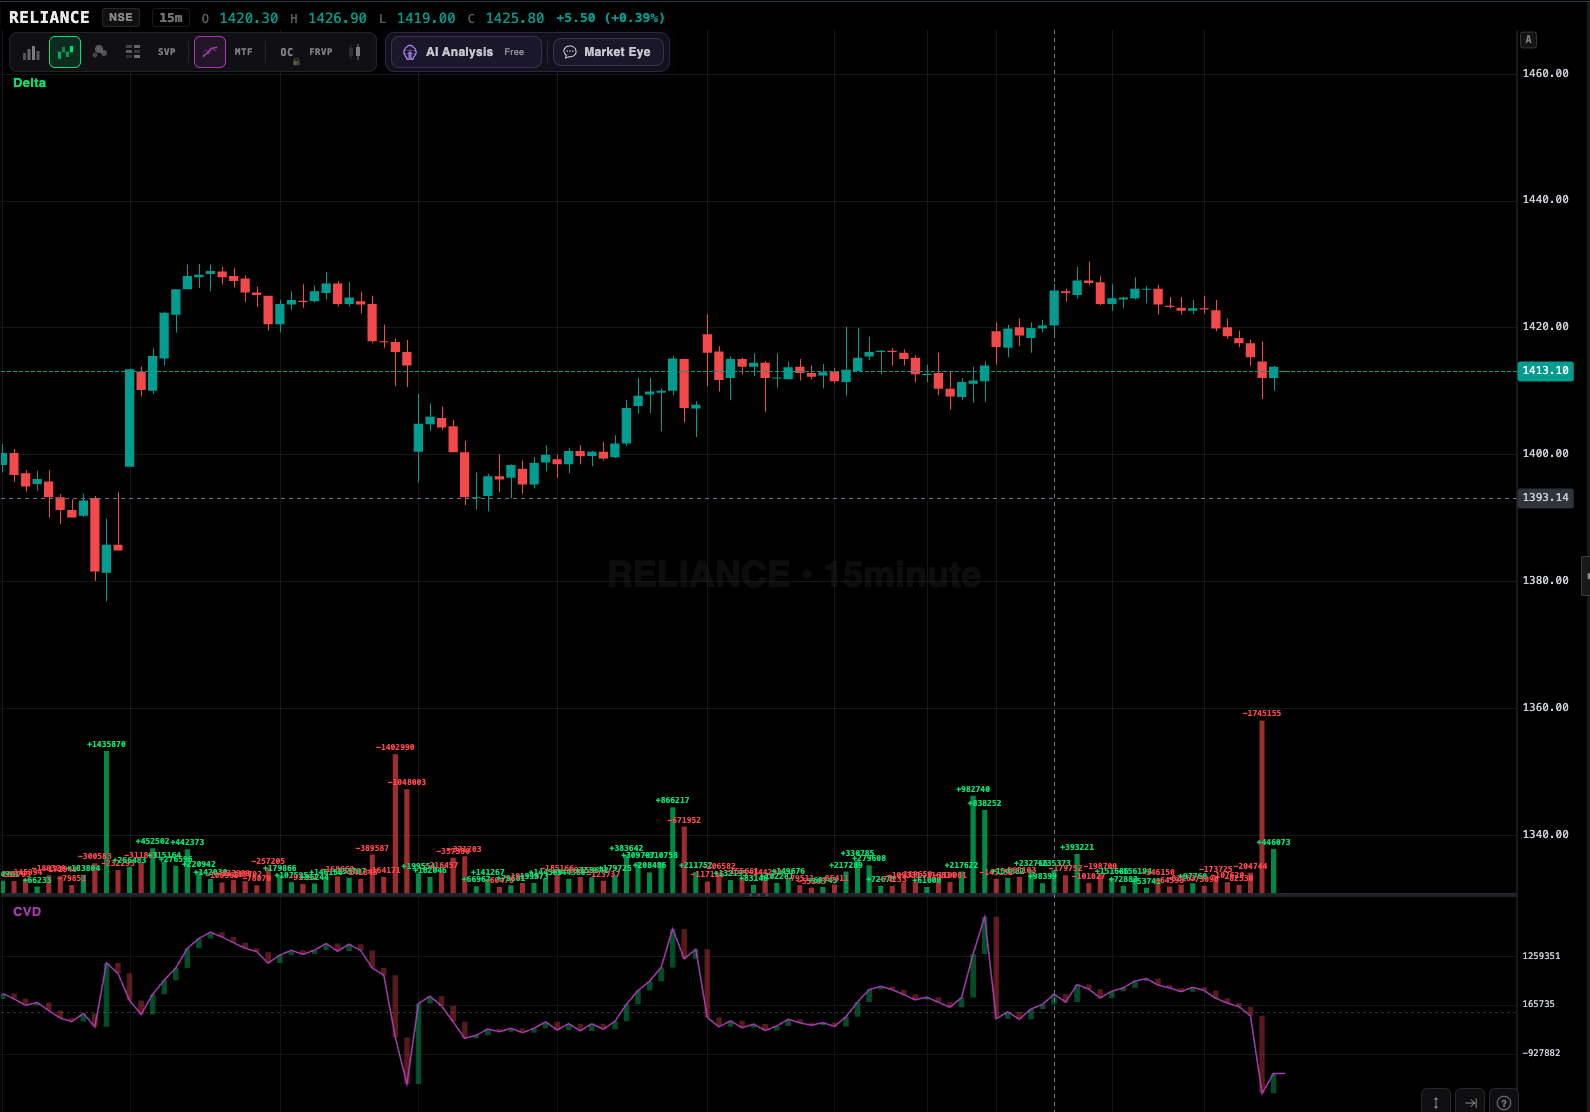
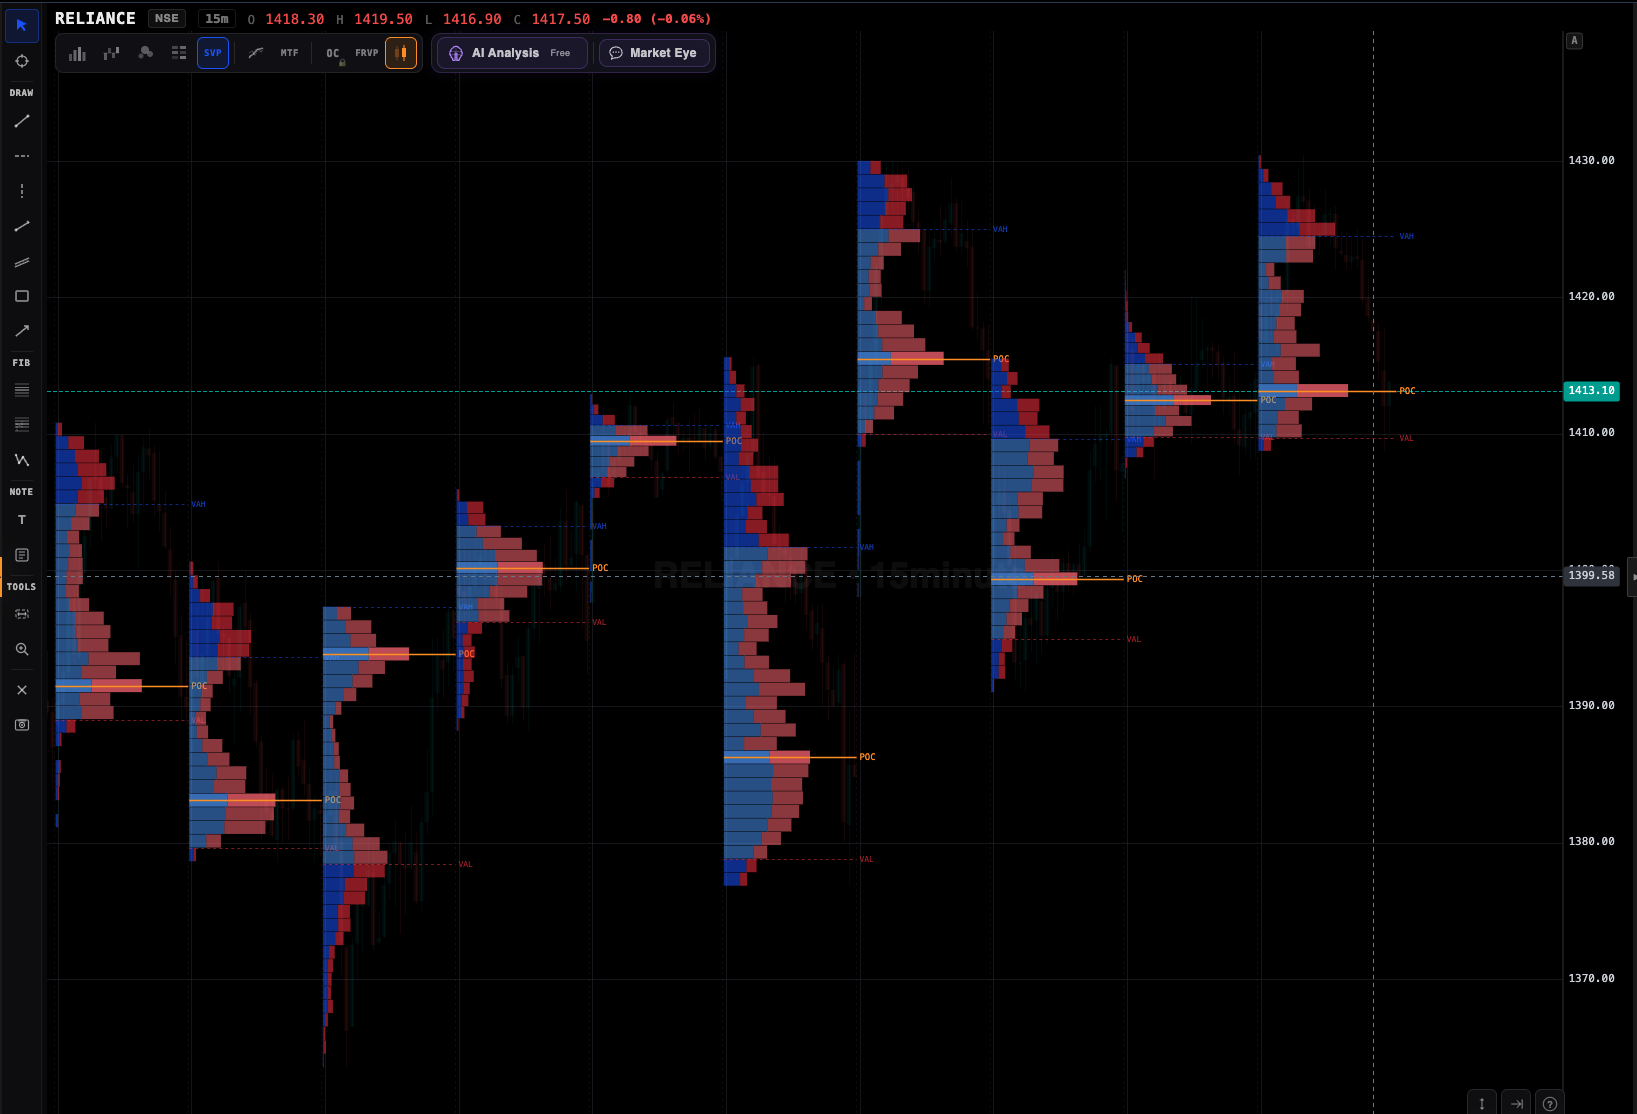
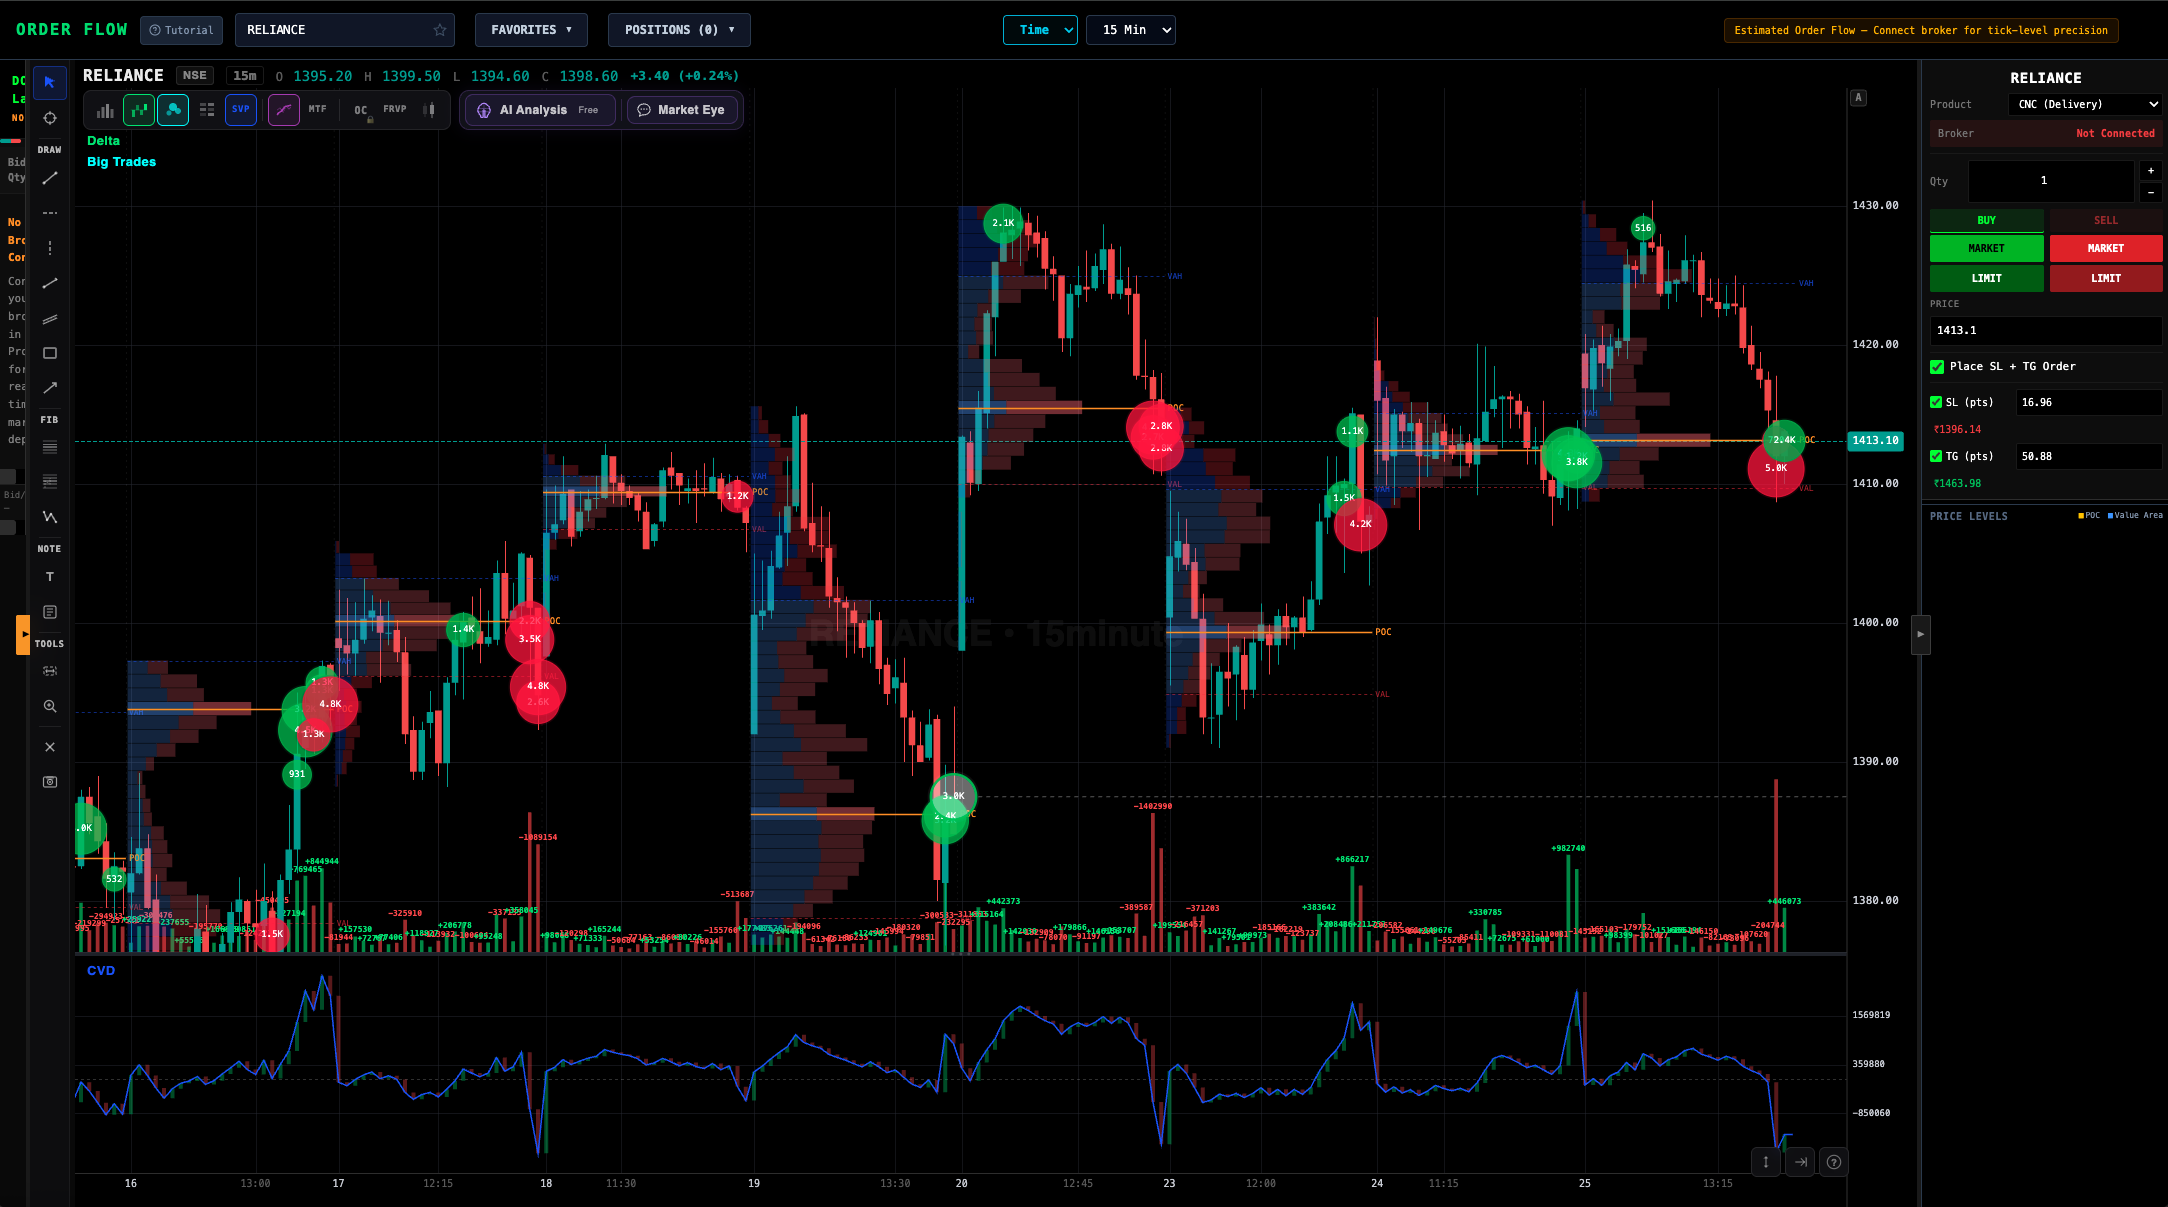
Order flow is the microstructure underneath the candle. A candle tells you the stock went from ₹2,450 to ₹2,465 on 3 lakh volume. That's it. It doesn't tell you whether buyers were aggressively lifting offers, or whether sellers just stopped pressing and the price drifted up on low volume.
Those two scenarios look identical on a candlestick chart. On an order flow chart, they look completely different — and the one that's actually sustainable will continue while the other reverses within minutes.
Order flow has been the standard for proprietary futures traders in the US and Europe for 15+ years. It is how funds at CME and Eurex make decisions. For Indian retail traders, it has been effectively unavailable — platforms either didn't support NSE tick data, or charged $400/month in foreign currency. VolumeLens changes that.
Each candle shows exact buy volume vs sell volume at every price level. Imbalances (3:1 or more one-sided) are auto-highlighted. See exhaustion at tops and absorption at bottoms.
Full 20-level DOM for NFO. See where large resting buyers and sellers sit. Spot iceberg orders by watching prints at the same price level. Click to place orders from the ladder.
Session, daily, weekly, and composite profiles. Point of Control (POC), Value Area High/Low, HVN and LVN nodes. Know your support and resistance from volume, not just price.
Running total of aggressive buy minus sell. CVD divergence from price is one of the cleanest reversal signals in existence — now available natively for NSE.

Indian equities are different from US equities. Liquidity is thinner. F&O expiry week is violent. Operators in mid-cap stocks move price on deliberately small volume to trap retail. HFT scalping is aggressive on Nifty futures. These conditions eat candle-based traders alive.
Order flow is how you see the manipulation coming. When RELIANCE looks like a breakout on the 5-minute chart but the footprint shows heavy sell-side aggression being absorbed by a single resting buyer, you know an operator is loading up and will push it higher. When BANKNIFTY looks weak on price but CVD is flat, you know the decline is low conviction and likely to mean-revert.
The trader who sees order flow sees the trade 30 seconds before the trader who doesn't. In Indian markets where a single 30-second move can be 0.5 to 1 percent, that is the difference between a winning month and a losing one.
| Situation | Candle-only trader | VolumeLens Order Flow trader |
|---|---|---|
| Breakout at resistance | Buys the breakout, stops out on fakeout | Checks footprint — if delta is weak, fades it instead |
| Gap-up open | Guesses direction, 50/50 | Reads first 5-min CVD — fades weak gaps, joins strong ones |
| Support retest | Buys blindly, no edge | Waits for absorption signal, enters with 3:1 R:R |
| Expiry day chop | Gets whipsawed | Stays out or scales based on volume profile extremes |
| Large block print | Doesn't see it | DOM ladder catches the footprint immediately |
Order flow data is hard. Most "footprint" charts on Indian platforms are faked from 1-minute candles — not real tick data. VolumeLens ingests the actual NSE tick stream via your broker connection (Zerodha or Groww) and aggregates it server-side into footprint clusters, DOM snapshots, and CVD series. Latency is under 500ms end-to-end.
Because it uses your own broker's tick feed, there's no extra data cost and the numbers match exactly what your broker sees. No more "why does this platform show a different volume than Kite" confusion.

Order Flow is the moat, but VolumeLens is a full platform. The same interface gives you:
Analysing live buy/sell orders at every price level to understand who is aggressive. It reveals what candlestick charts hide: whether moves are backed by real conviction or are weak drift.
Yes. VolumeLens is the first retail platform offering full order flow for NSE equity, BSE equity, and NFO (futures and options) instruments.
No. VolumeLens uses your existing Zerodha or Groww broker feed to ingest tick data. No additional subscription needed.
Sub-500ms end-to-end from exchange tick to footprint render. Fast enough for scalping and intraday.
Cumulative Volume Delta — the running sum of aggressive buys minus aggressive sells. Divergence between CVD and price is a classic reversal signal.
Yes. Click any price level on the ladder to place a limit order on your linked Zerodha or Groww account.
Yes, but liquidity matters. For stocks with less than ₹10 crore daily turnover, the footprint becomes sparse and less statistically meaningful. Order flow shines on liquid names — Nifty 500 equity and NFO index futures.
No. Everything is visual. Imbalances, divergences, absorption zones, and iceberg orders are auto-highlighted.
Footprint, DOM, volume profile, CVD — the tools that serious traders globally use, now native to NSE, BSE, and NFO.