Chartink finds the stock. Then you copy the symbol into Kite, open TradingView, do mental math, and hope you execute in time. VolumeLens scans, analyses, plans, and places the order on Zerodha or Groww. One platform. One click.
Chartink pioneered retail scanning in India. For years it was the only serious option. But the job of a trader has changed. Scanning is now the easy part. The hard part is what happens in the next 90 seconds — can you read the order flow, size the position correctly, set a sensible stop, and execute before the move is gone?
Chartink gives you a list of symbols. Nothing else. You open Kite in a new tab, paste the symbol, try to eyeball the chart, do back-of-envelope position sizing, enter the order, hope nothing slips, and finally go set up a separate GTT. By the time you are done, the breakout is either failed or already ₹8 above your intended entry.
VolumeLens was built by Indian traders who got tired of this juggle. Scan, footprint, plan, place, trail — all in one window, all in seconds. You stop losing the move to your own tooling.
| Capability | Chartink | VolumeLens |
|---|---|---|
| NSE + BSE equity scanning | Yes | Yes |
| Number of filters | 50+ | 55+ (incl. SEPA, RS, ATR) |
| Scan builder | Text-based formula | Point-and-click visual |
| Order Flow / Footprint charts | No | Yes |
| Volume Profile + VWAP bands | No | Yes |
| AI contextual analysis | No | Gemini-powered |
| One-click trade from scan | No | Zerodha + Groww |
| Automated trailing stop loss | No | Yes, GTT-backed |
| GTT OCO (SL + target together) | No | Yes |
| Chart trading (orders from chart) | No | Yes |
| Trade planner with R:R | No | Yes |
| Backtesting | Basic | Full OHLC replay |
| F&O with lot sizes | Limited | Full NFO |
55+ filters covering price action, volume anomalies, moving averages, RSI, MACD, ADX, Bollinger bands, candlestick patterns, relative strength vs Nifty, ATR volatility, and SEPA-style trend templates. Build conditions by clicking — no formula syntax to memorise. Save scans, share them, run them intraday or end-of-day.
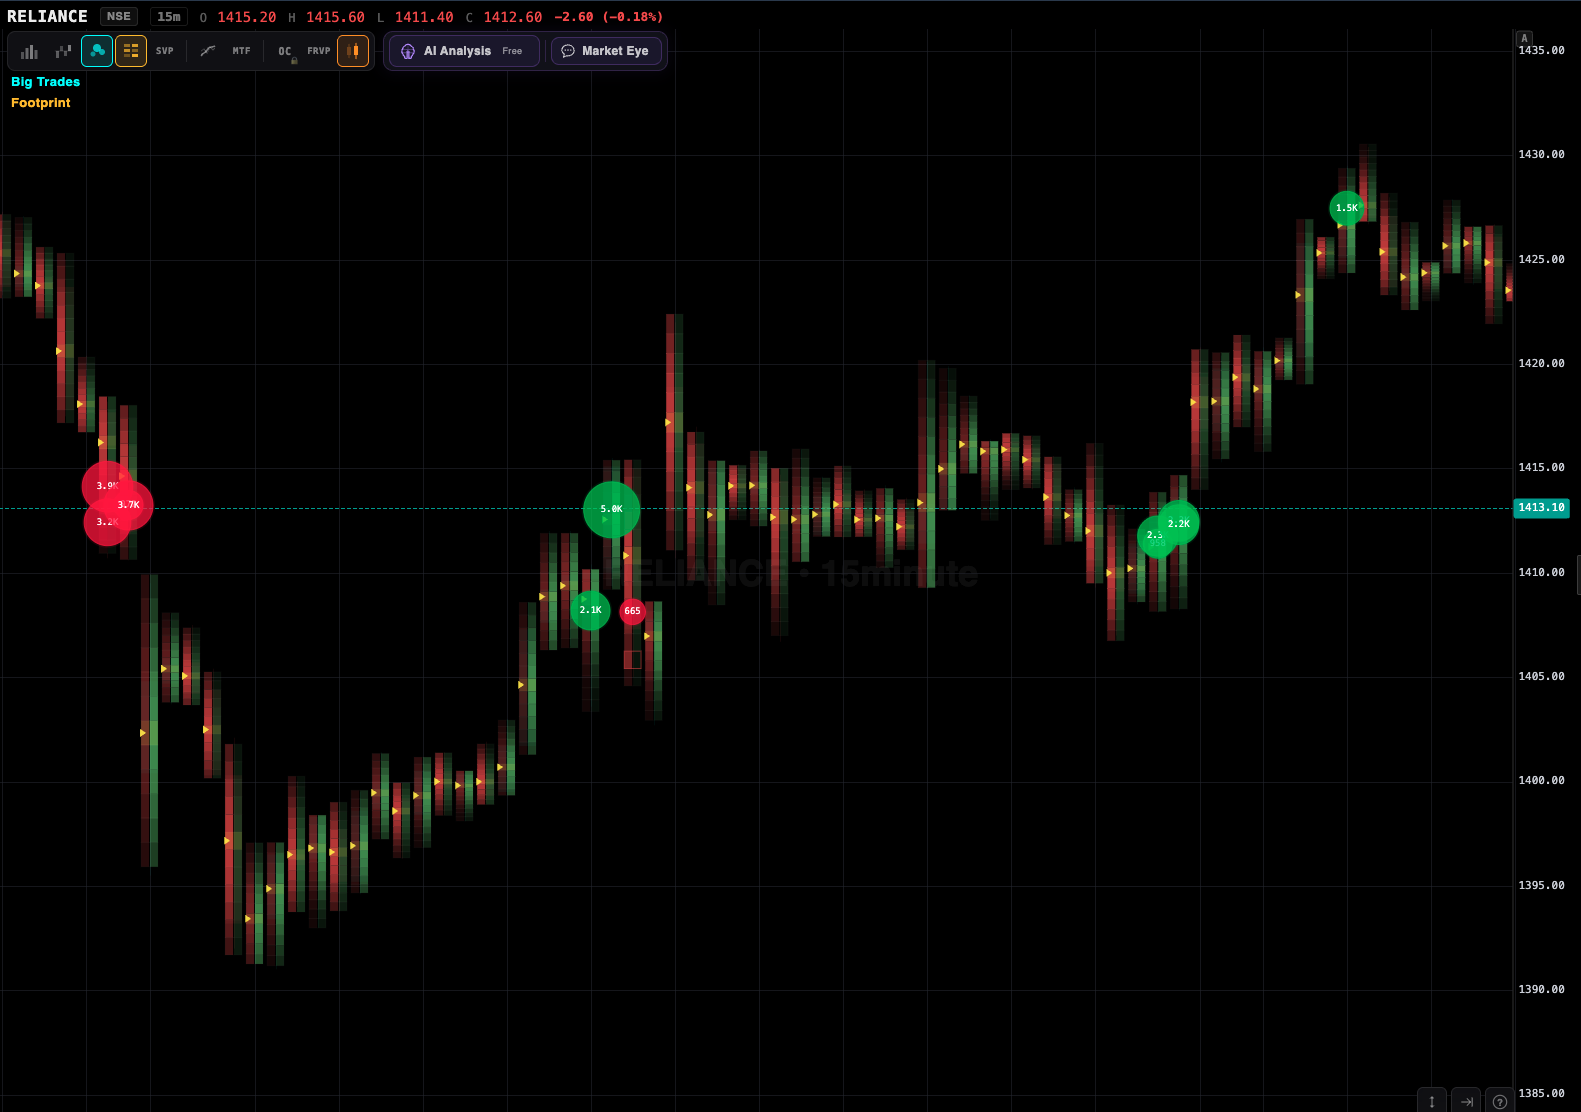
This is the real difference. After the scan finds the stock, VolumeLens shows you what is actually happening inside the candle: footprint bid/ask at every price level, cumulative volume delta, volume profile by session, DOM ladder with resting liquidity. You stop guessing whether a breakout has real buyers behind it.

Click any stock and get a Gemini-powered analysis that understands Indian market context — sector rotation, F&O open interest, PCR, results season, FII/DII flow. It cross-references your actual positions so the advice is specific to your book, not generic.
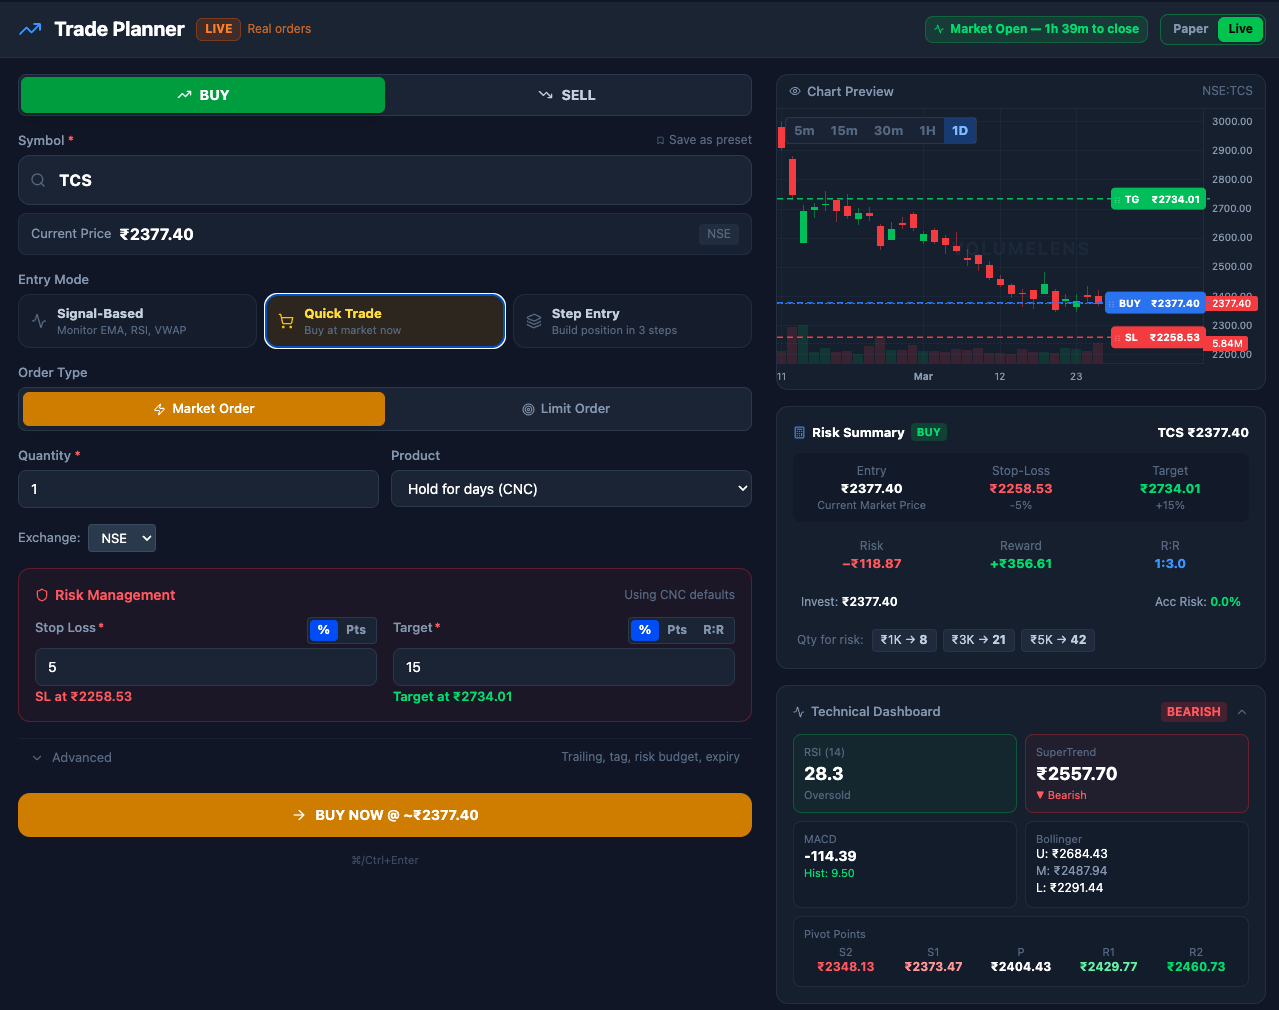
From a scanner row, click "Plan Trade". The planner auto-fills a 3-entry pyramid with R-multiple based position sizing, suggests the stop based on ATR or swing low, and places the order on Zerodha or Groww as MARKET, LIMIT, or bracket. Set a trailing stop once — VolumeLens manages the GTT lifecycle in the background.

No Zerodha or Groww? No problem. The scanner, charts, AI Mentor, and Order Flow work on Yahoo data. You only need to connect a broker when you are ready to execute.
Most retail traders think Chartink is "free". It isn't. The true cost is measured in:
The math is simple. If you trade 4 positions a week and lose ₹600 per trade to slippage and bad sizing, that is ₹1.2 lakh a year bleeding out of your account. The platform that saves you that slippage pays for itself many times over.
SEPA scanner, relative strength ranking, pyramid entry planner, automated trailing for multi-day holds.
Order Flow, CVD, volume profile, DOM ladder, chart trading. Everything you need to read flow in real time.
Correct NFO lot sizes, OI tracking, option-aware AI analysis, GTT OCO for option legs.
Automated trailing stops and GTT let you step away from the screen without fear. Set it and go back to your job.
Yes, there is a free tier with full scanner access. Order Flow, AI Mentor, and deep research use a coin-based pay-as-you-go model — you only pay for the specific analysis you run, not a monthly subscription you might not use.
Yes. VolumeLens covers the full NSE and BSE equity universe plus NFO F&O instruments with accurate lot sizes. You can also filter by sector, market cap, FII holding, and delivery percentage.
Yes, via Kite Connect. Link your account once, tokens refresh daily, and you place orders directly from the scanner, chart, or trade planner. Groww is also supported.
No. The scan builder is fully visual. Chartink uses a custom formula language which has a learning curve. VolumeLens lets you build a 5-condition scan by clicking dropdowns.
Yes, scans refresh intraday and alert you when a stock newly enters your filter conditions between 9:15 and 15:30 IST.
VolumeLens has a full OHLC-replay backtester for scanner strategies. You set the filter, the entry and exit rules, and it walks through historical data candle-by-candle showing win rate, R-multiple, and drawdown.
VolumeLens is a screening and analysis tool, not a SEBI-registered investment advisor. We do not recommend trades. You stay in full control of every decision — the platform just makes the data and execution faster.
Most Chartink scans recreate in 2 minutes on VolumeLens using the visual builder. Our team can also help you port over complex scans — reach out on the contact page.
Join Indian traders who replaced Chartink, TradingView, and manual Kite entry with a single integrated platform.