55+ real-time filters across price action, volume, technicals, fundamentals, F&O open interest, and delivery percentage. Find the setup in seconds. Execute on Zerodha or Groww in one click. No formula language. No coding.

Most "stock screeners" in India are glorified filters on yesterday's closing price. They'll show you stocks above their 50-day moving average. Good — but so will every other retail trader. The scan gives you zero edge.
A real screener for Indian markets has to handle the weird stuff that actually separates winning trades from noise: delivery percentage, NFO open interest build-up, block-deal alerts, relative strength vs Nifty, SEPA trend templates, pivot-level proximity, and volume signature patterns. VolumeLens has all of these, built specifically for NSE and BSE structure.
New 52-week highs/lows, pivot point proximity, day range percentage, gap up/down, consolidation detection, breakout from base, swing high/low sweeps.
Relative volume (5/10/20 day), volume-price anomaly, delivery percentage, block deal proximity, turnover ratio, OBV divergence.
RSI (14/21/50), MACD cross, ADX trend strength, Bollinger squeeze, ATR expansion, Stochastic overbought/oversold, supertrend signal.
Price above/below 20/50/100/200 EMA, MA crossovers (golden/death), stacked MA alignment, distance from MA in percent, SEPA template qualification.
Hammer, engulfing, piercing, three white soldiers, inside bar, outside bar, morning/evening star, harami — on any timeframe.
OI build-up (long/short), PCR, IV rank, IV percentile, max pain, strike-wise OI shifts, rollover percentage, NFO lot-size aware sizing.
RS rating vs Nifty50, sector RS, IBD-style RS ranking (1-99), outperformers of the week/month/quarter.
Market cap bucket, PE vs sector median, ROE, debt/equity, quarterly results proximity, FII/DII holding shifts, promoter pledge.
The real value of a screener isn't finding the stock — it's converting the find into a trade before the edge is gone. Here's the typical workflow for an Indian retail trader on a 5-tool stack vs on VolumeLens:
| Step | Chartink + Kite + TV | VolumeLens |
|---|---|---|
| Run scan | Chartink tab, 30 sec | VolumeLens, 20 sec |
| Check chart | Open TradingView tab, 40 sec | Click row, chart inline, 2 sec |
| Read order flow | Not available | Integrated footprint, 5 sec |
| Calculate position size | Excel or calculator, 90 sec | Auto-calc based on R, 1 sec |
| Enter order | Open Kite, paste symbol, enter, 60 sec | One click, 1 sec |
| Set stop and target | Separate GTT on Kite, 90 sec | GTT OCO placed automatically, 0 sec |
| Set trailing stop | Not possible | Toggle on, 1 sec |
| Total time | ~8-15 minutes | 30 seconds |

Stocks closing above 20-day high, volume > 2x average, price above 50 EMA, RS rating > 70, no earnings in next 3 days. Add ATR filter to exclude penny chop.
Top 50 stocks by 3-month RS vs Nifty, currently within 10% of 52-week high, trading above 50 EMA, market cap > ₹2,000 crore. Classic Minervini-style list.
NFO stocks with OI up > 5% day-on-day, price up > 1%, PCR dropping, rollover > 70%. The textbook definition of a long build-up: open interest and price rising together.
Stocks where today's delivery percentage is > 60% and > 1.5x the 10-day average. Shows sessions where far more of the traded volume was taken into delivery than usual.
Gap up > 1% with volume > 2x pre-market average in first 15 min, price above VWAP, RSI > 60. Intraday trend day candidates.
Each of these can be built in the visual scan builder, adjusted, and saved as your own scan.
You don't need a broker account to use the scanner, charts or AI analysis — scans run on VolumeLens market data whether or not a broker is linked. Connecting a Zerodha or Groww account adds order placement from scan results, the chart and the trade planner.
This matters because most Indian retail traders keep their broker logged in only during market hours. The rest of the time — research at 10pm, weekend planning — you should still have full screener access. VolumeLens gives you that.
Save any scan and turn on intraday alerts. When a new stock newly satisfies your conditions between 9:15 and 15:30 IST, you get an in-app, push or Telegram notification. No more refreshing manually every 15 minutes.
Combine with the trade planner auto-fill and you can effectively set up "when stock X breaks out, draft the trade with these parameters and wait for my approval". This is as close to hands-free swing trading as a retail stack gets without going full algo.
Free daily data: NSE delivery percentage for all stocks · Nifty pivot points · order flow platforms in India compared
The public scanner is free with no login. With an account, each scan run uses coins — new accounts get their first scan free — and alert monitoring, AI analysis and deep research are also priced per use in coins. See current pricing.
Combine filters from the 55+ available in the visual scan builder — technical, volume, delivery and fundamental conditions in one scan, with no formula language.
About 2,000 NSE-listed stocks, including F&O stocks with their current lot sizes.
Scans combine NSE end-of-day history with live prices during market hours, so percentage changes reflect the current session.
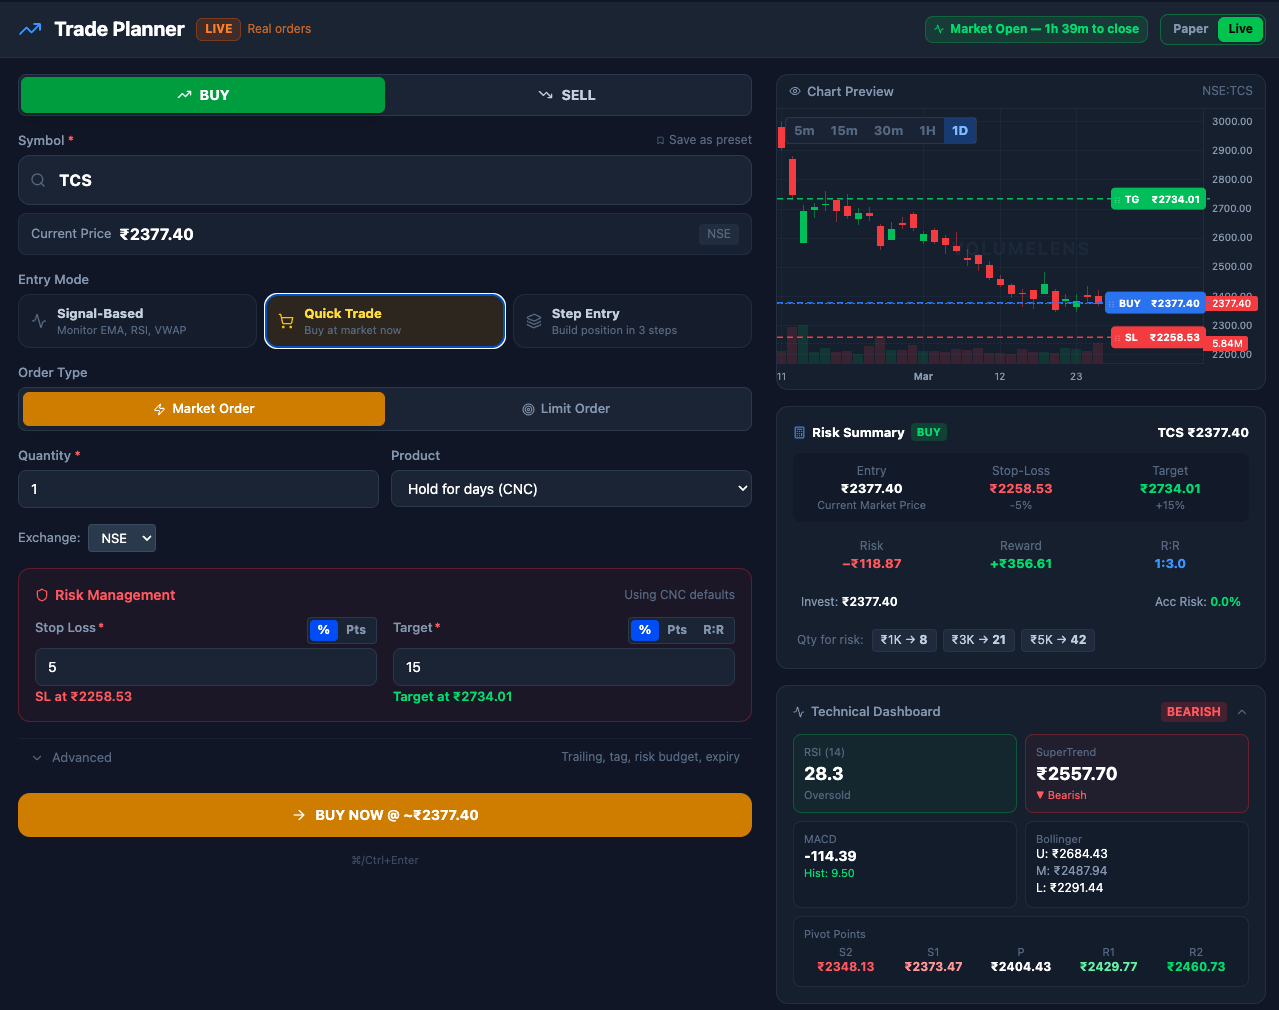
Yes. Click any scan result, the trade planner opens pre-filled with the symbol. Set your entry, stop, target, and one click places the order on your connected broker account with GTT OCO set up automatically.
Yes. Save scans, turn on alerts (in-app, push or Telegram), and share scan links.
Chartink is scan-only. VolumeLens is scan + order flow + AI + execution + risk management in one platform. See the Chartink comparison for a full breakdown.
The scanner is fully mobile-responsive. Charts and order flow are best on desktop or tablet. Execution works on mobile.
No credit card. No complex onboarding. Link your broker only when you're ready to execute.